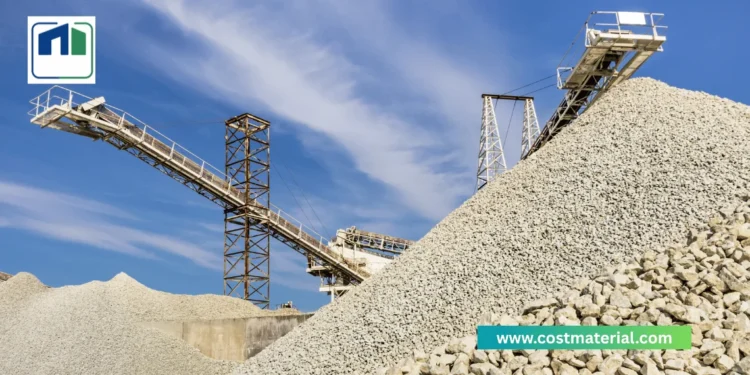
The construction industry in the Philippines is booming. Therefore, understanding the aggregates price 2025 is crucial. Aggregates, like sand and gravel, form the backbone of any building project. They are essential for concrete, asphalt, and various construction bases. This year, the market anticipates significant activity. We will explore current prices, influencing factors, and future outlook.
Understanding the Aggregates Market in 2025
The Philippine construction aggregates market shows robust growth. Experts estimate its value at USD 3.97 billion in 2025. Furthermore, it projects a Compound Annual Growth Rate (CAGR) of 5.7% through 2032. This sustained demand trajectory signals a vibrant sector.
Aggregates are indispensable raw materials. They are fundamental components of concrete and asphalt. Their cost directly impacts overall project expenses. This includes large national infrastructure and smaller residential builds. The Philippine construction market is expanding rapidly. It expects an 8.4% annual growth rate. This growth should reach PHP 1.94 trillion in 2025. Such strong expansion naturally demands a consistent supply of aggregates.
The price and availability of aggregates indicate the construction sector’s health. Their demand links directly to construction pace. Significant growth in 2025 means increased consumption of crushed stone, sand, and gravel. Consequently, aggregate price fluctuations or supply disruptions affect project viability. Monitoring these trends is vital for understanding the industry’s momentum. It also reveals cost pressures within the Philippine construction industry.
Current Aggregates Price 2025: A Regional Snapshot
Aggregate pricing in the Philippines varies greatly. Location and aggregate type play a big role. A single national price list is not publicly available. However, official indices and regional supplier data offer valuable insights.
National Capital Region (NCR) Price Indices
The Philippine Statistics Authority (PSA) tracks construction material prices in NCR. These indices provide general trend indications.
Construction Materials Wholesale Price Index (CMWPI) for Sand and Gravel
In June 2025, sand and gravel in NCR saw a slight annual increase. It rose to 0.6% from 0.4% in May 2025. This upward movement suggests a modest cost increase. Earlier, in April 2025, sand and gravel also increased by 0.4% year-on-year. This was up from 0.3% in March 2025. In January 2025, prices showed a 0.1% annual increase. This marked a recovery from a 0.4% annual decline in December 2024. This pattern indicates a gradual firming of wholesale prices.
Construction Materials Retail Price Index (CMRPI) for Relevant Categories
The overall CMRPI in NCR increased to 1.1% in June 2025. It was 1.0% in May 2025. Masonry materials, which use many aggregates, showed a higher increase. They rose to 1.2% in June 2025 from 1.1% in May. Conversely, in February 2025, the overall CMRPI decelerated to 1.1%. Masonry materials also slowed their increase to 0.2%. These fluctuations highlight dynamic retail prices in NCR.
Data availability differs significantly between NCR and Cebu. NCR provides indices, while Cebu offers direct prices. This highlights the localized nature of aggregate markets. Pricing is not uniform nationwide. Local quarry availability, regional demand, and transport costs heavily influence prices. A national average price would likely mislead. Granular data is challenging to obtain publicly. Therefore, stakeholders must focus on regional variations. For precise budgeting, they need direct supplier quotations.
The CMWPI for sand and gravel shows an upward trend in NCR. It moved from 0.4% to 0.6% between May and June 2025. Similarly, the CMRPI for masonry materials increased from 1.1% to 1.2%. This consistent upward movement indicates price increases originate at wholesale levels. Businesses sourcing aggregates in NCR should expect continued, modest price increases. This reinforces the need for proactive procurement strategies.
Regional Aggregates Price 2025 Spotlights
Beyond NCR, specific price data from key regions offers a clearer view.
Cebu City (Central Visayas)
As of July 2025, a major supplier in Cebu City lists specific delivery prices :
Washed Gravel (3/4): ₱1300.00 per cubic meter.
Washed Sand: ₱1300.00 per cubic meter.
Boulders (mix sizes): ₱950.00 per cubic meter.
These prices are subject to change without notice. This reflects the dynamic nature of local markets.
Luzon (General)
Specific 2025 data for all of Luzon is limited. However, 2024 price ranges indicate general levels. Luzon prices are typically lower than Metro Manila rates.
River Sand (Washed): ₱1,200 – ₱1,600 per cubic meter.
Crushed Gravel: ₱700 – ₱1,000 per cubic meter.
Mixed Aggregates: ₱900 – ₱1,200 per cubic meter.
Marine Sand: ₱1,000 – ₱1,400 per cubic meter.
Other Key Regions
Direct 2025 aggregate price lists are not available for Western Visayas, Eastern Visayas, or Mindanao. However, general inflation data provides indirect context. Central Visayas saw its inflation rate drop to 0.9% in May 2025. This was down from 2.0% in April. Falling food prices largely caused this. Low inflation could ease construction cost pressures.
Northern Mindanao’s inflation rate increased to 2.9% in January 2025. This was up from 2.6% in December 2024. Rising costs in food, transport, and restaurant services drove this. Regional inflation rates vary significantly. This impacts local construction costs differently. Construction project budgeting must account for these nuances.
Units of Measurement and Conversion
The metric system has been compulsory in the Philippines since 1860. For construction aggregates, the cubic meter (cu.m.) is widely used. However, the “ton” is also common, especially in global reports.
Converting between cubic meters and tons is crucial. This conversion depends on the material’s bulk density. Coarse aggregates typically range from 1.5 to 2.2 tonnes per cubic meter. Fine sand has an apparent density of 2380 kg/m³. Its bulk density is 1320 kg/m³. Optimized medium sand has an apparent density of 2570 kg/m³. Its bulk density is 1550 kg/m³. Coarse aggregate (10-20mm) has a bulk density of 2870 kg/m³. Dry sand densities range from 1540-1600 kg/m³. Wet sand ranges from 1760-2000 kg/m³. Remember, 1 metric ton equals 1000 kilograms.
The ability to convert units is essential for stakeholders. Prices are quoted in different units. Without clear conversion factors, direct comparison is impossible. Providing typical density ranges allows users to calculate their own figures. This empowers users to standardize price comparisons. They can accurately estimate material quantities for budgeting. This addresses a fundamental practical challenge in aggregate procurement.
Table 1: Common Aggregate Units and Typical Conversion Factors (Philippines)
| Aggregate Type | Typical Bulk Density Range (kg/m³) | Conversion Factor (tonnes per cubic meter) | Common Selling Unit |
| Washed Sand | 1320 – 1550 | 1.32 – 1.55 | Cubic Meter (cu.m.) |
| Washed Gravel (3/4) | 1550 – 2200 (coarse) | 1.55 – 2.20 | Cubic Meter (cu.m.) |
| Boulders | 2870 (coarse aggregate) | 2.87 | Cubic Meter (cu.m.) |
| River Sand | 1540 – 2000 | 1.54 – 2.00 | Cubic Meter (cu.m.) |
| Crushed Gravel | 1550 – 2200 (coarse) | 1.55 – 2.20 | Cubic Meter (cu.m.), Ton |
The following table consolidates available regional aggregate price ranges. It directly addresses the core user inquiry about updated prices. This presentation enables quick comparison across regions. It highlights existing regional disparities. Explicitly noting sources and limitations helps manage expectations. These concrete figures serve as a realistic starting point for budgeting.
Table 2: Regional Aggregates Price 2025 Ranges (PHP/cubic meter) (where available)
| Region/City | Aggregate Type | Price Range (PHP/cubic meter) | Data Source/Context | Notes |
| Cebu City | Washed Gravel (3/4) | ₱1300.00 | Cebu Sand and Gravel Supplier | Prices subject to change without prior notice. |
| Cebu City | Washed Sand | ₱1300.00 | Cebu Sand and Gravel Supplier | Prices subject to change without prior notice. |
| Cebu City | Boulders (mix sizes) | ₱950.00 | Cebu Sand and Gravel Supplier | Prices subject to change without prior notice. |
| Luzon (General) | River Sand (Washed) | ₱1,200 – ₱1,600 | 2024 Data, indicative range | Generally lower than Metro Manila rates. |
| Luzon (General) | Crushed Gravel | ₱700 – ₱1,000 | 2024 Data, indicative range | |
| Luzon (General) | Mixed Aggregates | ₱900 – ₱1,200 | 2024 Data, indicative range | |
| Luzon (General) | Marine Sand | ₱1,000 – ₱1,400 | 2024 Data, indicative range | Limited use, some coastal projects. |
| NCR (Wholesale) | Sand and Gravel | N/A (Index: +0.6% in Jun 2025) | PSA CMWPI | Indicates increasing trend. |
| NCR (Retail) | Masonry Materials | N/A (Index: +1.2% in Jun 2025) | PSA CMRPI | Indicates increasing trend. |
Factors Influencing Aggregates Price 2025
The pricing of construction aggregates in the Philippines is complex. It involves broad economic forces and specific supply-side challenges. Robust demand from a thriving construction sector also plays a role.
Overall Construction Industry Outlook
The Philippine construction market expects robust growth in 2025. It forecasts an 8.4% annual growth rate. This aims to reach PHP 1.94 trillion. The sector experienced strong growth from 2020-2024, with an 11.8% CAGR. This upward trajectory should continue at 6.6% from 2025 to 2029. The sector could expand to PHP 2.71 trillion by 2029. GlobalData forecasts 6.2% real growth for the industry in 2025. Public and private investments support this. Construction loans increased by 13.2% year-on-year in early 2025. Approved building permits grew by 22%. The aggregates market itself should reach USD 3.97 billion in 2025. It projects growth to USD 5.85 billion by 2032. This shows a 5.7% CAGR.
Economic Influences on Aggregates Price 2025
Several economic factors directly affect aggregate costs.
Inflation Rates
National inflation eased to 1.4% in April 2025. This suggests a general moderation in price increases. Regionally, Central Visayas saw its inflation rate drop significantly. It fell to 0.9% in May 2025 from 2.0% in April. Falling food prices primarily caused this. Low inflation is generally favorable for consumers. It could indirectly ease some cost pressures on construction.
Northern Mindanao, however, recorded a 2.9% inflation rate in January 2025. This increased from 2.6% in December 2024. Rising costs in food, transport, and restaurant services drove this. Regional inflation trends diverge significantly. This impacts local construction costs differently. Lower inflation means less upward pressure on input costs. Higher inflation implies greater cost challenges. Construction project budgeting must consider these regional economic nuances. A national average may not reflect specific project locations.
Fuel Price Fluctuations
Fuel prices represent a significant variable cost. They directly impact the aggregates supply chain. Oil companies increased prices for gasoline, diesel, and kerosene on July 15, 2025. These adjustments were influenced by international market developments. Gasoline rose by PHP0.35-0.70 per liter. Diesel increased by PHP0.70-1.40 per liter. Kerosene went up by PHP0.50-0.80 per liter. Conversely, slight rollbacks occurred on July 8, 2025. Gasoline dropped P0.70 per liter. Diesel fell P0.10. Kerosene decreased P0.80.
Overall net increases for the year remain substantial. Gasoline is up PHP8.30 per liter. Diesel is up PHP9.95 per liter. Kerosene is up PHP1.05 per liter. The CMWPI for fuels and lubricants showed a slower annual decline. It was 3.4% in June 2025, compared to 4.7% in May 2025. This indicates a deceleration in the rate of price decrease. This volatility and persistent net increase translate directly to higher transportation costs for aggregates. Delivered costs to construction sites are heavily influenced by these movements. This creates a significant variable cost for contractors and suppliers. It also impacts quarrying machinery operation.
Labor Costs and Skilled Labor Shortages
A recognized shortage of skilled labor exists in the construction sector. This directly contributes to increased wages. Consequently, overall construction costs rise. The industry invests in training programs to address this gap. This may influence future labor cost trends. Rising costs and labor shortages are critical challenges. They affect residential, industrial, and institutional construction. Higher labor costs translate directly to increased operational costs for aggregate producers. This, combined with fuel price volatility, puts upward pressure on the supply chain. These costs are likely passed on to consumers.
Supply-Side Factors Affecting Aggregates Price 2025
Several factors on the supply side influence aggregate prices.
Quarrying Costs and Production Trends
The Philippines Construction Aggregates Market expects growth. Strong demand from infrastructure and residential construction drives this. This implies sustained quarrying activity. Historically, the market for gravel, pebbles, and crushed stone saw a slight decrease. It fell by -0.1% to $1.3 billion in 2024. This followed three years of decline. However, the outlook for 2025 and beyond is positive.
The Mines and Geosciences Bureau (MGB) monitors non-metallic prices. Past data shows ranges for “Mixed Sand & Gravel”. For example, it was ₱538.28 per cubic meter in Visayas (2019 data). “Crushed Aggregate Base Course” was ₱710.02 per cubic meter. As of December 2024, 59 operating non-metallic mines existed. This included 14 basalt/aggregates quarries. Numerous LGU-issued permits for smaller operations also exist. This indicates a diverse supply base.
Environmental Regulations, Permitting, and Rehabilitation
Mining contractors must implement environmental protection programs. They submit comprehensive rehabilitation plans. The Environmental Impact Assessment (EIA) process is compulsory. This secures an Environmental Compliance Certificate (ECC). Mining operations face various taxes and fees. These include excise tax, VAT, customs duties, and local business taxes. Annual occupation fees and mine waste/tailings fees also apply. Royalties are paid to Indigenous Cultural Communities (ICCs) or the MGB. These extensive regulations and fees represent significant costs. They are passed on to aggregate prices. Stricter enforcement or tax increases would raise prices. This also acts as a barrier for new, smaller players.
Key Players and Market Concentration
Major players include Holcim Philippines Inc. and Metrocem Cement Ltd.. Eagle Cement Corp., Island Quarry & Aggregates Corporation, and Pacific Cement Phils Inc. are also key. Market concentration is described as “Medium”. A tiered pricing system exists. Large infrastructure companies negotiate lower prices. They pay USD 8-15 per ton. This is due to high-volume contracts and proximity to quarries. Small to mid-sized firms pay higher prices. They pay USD 10-25 per ton. This is due to smaller loads and higher transportation costs.
This tiered pricing structure means smaller contractors face higher costs. They have less bargaining power. This impacts their competitiveness. It also highlights the critical importance of logistics optimization.
Demand Drivers for Aggregates in 2025
Robust demand for construction aggregates stems from two main areas. These are expansive government infrastructure programs and significant building initiatives. Both are planned for 2025 and beyond.
Government Infrastructure Programs
The “Build Better More” infrastructure program is a primary catalyst. It aims to enhance public infrastructure nationwide. This increases demand for construction materials and labor. The 2025 Budget allocates substantial funds. PHP 861.2 billion ($14.9 billion) goes to transport infrastructure. PHP 257.1 billion ($4.5 billion) targets water infrastructure. Education and healthcare facilities also receive significant allocations.
Mega-projects like the Metro Manila subway consume immense aggregates. It requires over 10,000 metric tons of coarse and fine aggregates daily. In April 2025, 14 new projects joined the PPP pipeline. This brought the total to 187 projects. They are valued at PHP 2.6 trillion ($45.1 billion). Major ongoing projects include the PHP 18.3 billion Iloilo Global City project. The PHP 5.3 billion Subic International Airport project also contributes.
Central Visayas’ Infrastructure Development Committee endorsed FY 2025 funding. This includes ongoing multi-year projects. Examples are the Cebu Bus Rapid Transit Project and New Dumaguete Airport Project. The Malinao Dam Improvement Project in Bohol is also included. The Metro Cebu Expressway and Panglao-Tagbilaran Offshore Bridge Connector are notable. These are part of the Central Visayas Regional Development Investment Program.
The sheer volume of projects indicates sustained demand. This acts as a primary upward pressure on prices. Numerous large-scale projects create a continuous need for aggregates. This demand exceeds short-term supply fluctuations. It grants suppliers leverage in pricing. This demand-driven environment suggests price stability or slight increases.
Localized demand surges occur in regions with major projects. This can strain local aggregate supply chains. It potentially leads to higher prices in those areas. Businesses should conduct granular regional analysis. Opportunities for aggregate suppliers are strong in these hotspots. Buyers should anticipate higher prices and plan procurement early.
Residential and Commercial Building Initiatives
Rapid urbanization remains a significant driver. The urban population in the Philippines should reach 58% by 2025. This fuels substantial demand for residential construction. The National Housing Authority planned over 500,000 housing units by 2023. Private developers aimed to deliver nearly 1 million new homes. This collectively boosted demand for quarry materials. The residential sector offers opportunities in sustainable and affordable housing. Government initiatives and consumer demand drive this. The overall construction cost per square meter in February 2025 was ₱10,919.23. Residential construction specifically estimated ₱12,182.44 per square meter.
Navigating the Aggregates Market: Outlook and Recommendations
The outlook for aggregates price 2025 is shaped by several factors. Strong demand, varying regional conditions, and persistent cost pressures all play a part.
Forecasted Price Trends for Aggregates for the Remainder of 2025
Robust growth projects for the construction market. An 8.4% annual growth is expected in 2025. Extensive infrastructure and residential projects drive sustained demand. Therefore, aggregate prices should remain stable. A slight upward trend is anticipated for the latter half of 2025. Wholesale prices for sand and gravel in NCR already show modest increases. This indicates continued pressure from the supply side.
National inflation shows signs of easing. However, regional variations persist. Fuel price volatility will impact transportation costs. These costs form a significant component of delivered aggregate prices. The Philippines Construction Aggregates Market projects growth. It expects a 5.7% CAGR from 2025 to 2032. This suggests a long-term upward trajectory for market value. It implies price growth alongside volume expansion.
Strategic Implications for Businesses Involved in Construction, Procurement, and Investment
Sustained high demand, regional price disparities, and volatile input costs define the market. These include fuel, labor, and regulatory compliance. Proactive cost management and strategic procurement are essential for all stakeholders.
For Construction Firms and Developers:
Proactive Procurement: Secure long-term supply agreements. Consider bulk purchasing contracts for aggregates. This is especially important in high-growth regions. It effectively mitigates cost volatility.
Logistics Optimization: Invest in efficient logistics and transportation solutions. This offsets rising fuel costs. It also reduces the delivered price of aggregates. Prioritize suppliers closer to project sites. This significantly reduces transportation overhead.
Budget Contingency: Incorporate a contingency buffer in project budgets. This accounts for unforeseen aggregate price fluctuations. Fuel costs and dynamic regional demand drive these changes.
For Aggregate Suppliers and Investors:
Capacity Expansion: The strong demand outlook justifies investments. Expand quarrying and processing capacities. Focus on regions with significant infrastructure projects.
Efficiency Improvements: Continuously focus on operational efficiencies. Manage rising labor and regulatory costs. This maintains competitiveness in the market.
Market Diversification: Explore opportunities in other high-growth provincial areas. Substantial infrastructure pipelines could yield significant benefits.
Recommendations for Mitigating Risks and Capitalizing on Opportunities
Businesses must actively manage risks and seize opportunities.
Risk Mitigation:
Supply Chain Resilience: Diversify your supplier base. This reduces reliance on a single source. It also helps against potential regulatory or operational disruptions.
Hedging Strategies: For large projects, explore hedging against fuel price increases. Incorporate escalation clauses into contracts. This provides a buffer against volatility.
Regulatory Compliance: Ensure full and continuous compliance. Adhere to environmental regulations and permitting requirements. This avoids costly delays, fines, or operational suspensions.
Opportunity Capitalization:
Technology Adoption: Leverage modern construction technologies. Utilize digital tools for project management. Improve demand forecasting and optimize supply chain operations. This leads to greater efficiency and cost savings.
Public-Private Partnerships (PPPs): Actively engage in PPPs for infrastructure projects. These initiatives drive aggregate demand. They offer structured, long-term engagement prospects.
Sustainable Practices: Invest in sustainable quarrying and aggregate production. Align with growing demand for green building practices. This may also qualify for various incentives. It positions businesses favorably for future market trends.
The Philippine construction and aggregates market shows a strong long-term outlook. It presents significant investment opportunities. The market projects substantial growth from 2025 to 2032. Urbanization and extensive government infrastructure drive this. This sustained growth indicates a healthy underlying market. It makes investments in aggregate production attractive. While short-term challenges exist, macro-economic trends support a positive long-term view. This environment encourages strategic, patient capital investment. Focus on resilient and efficient operations to capitalize on future demand.
References
- Philippines Construction Aggregates Market Size and Share Analysis – Growth Trends and Forecast 2025-2032.
- Cebu Sand and Gravel Supplier.
- Philippines Construction Industry Databook 2025: Residential, Commercial, Industrial, and Institutional Insights, Market Size & Forecast by Value and Volume 2020-2029.
- Northern Mindanao posts 2.9% inflation in January 2025.
- Philippines – Gravel, Pebbles and Crushed Stone for Concrete and Road Aggregates – Market Analysis, Forecast, Size, Trends and Insights.
- Philippines Construction Market Size, Trend Analysis by Sector, Competitive Landscape and Forecast to 2029 (Q2 2025).
📢 Did you find this guide helpful? Share it to others! For more construction material price list, check our other blog post.
